Matlab建立地球模型
建立地球2D、3D模型,方便后续加卫星轨道。
建立地球2D、3D模型,方便后续加卫星轨道。
earth.m
1
2
3
4
5
6
7
8
9
10
11
12
13
14
15
16
17
18
19
20
21
22
23
24
25
26
27
28
29
30
31
32
%% 基本数据
G = 6.67430e-11; % 万有引力常数
M_earth = 5.972e24; % 单位:千克
M_moon = 7.348e22; % 单位:千克
R_earth=6371; %地球半径,单位km
%% 绘制地球模型
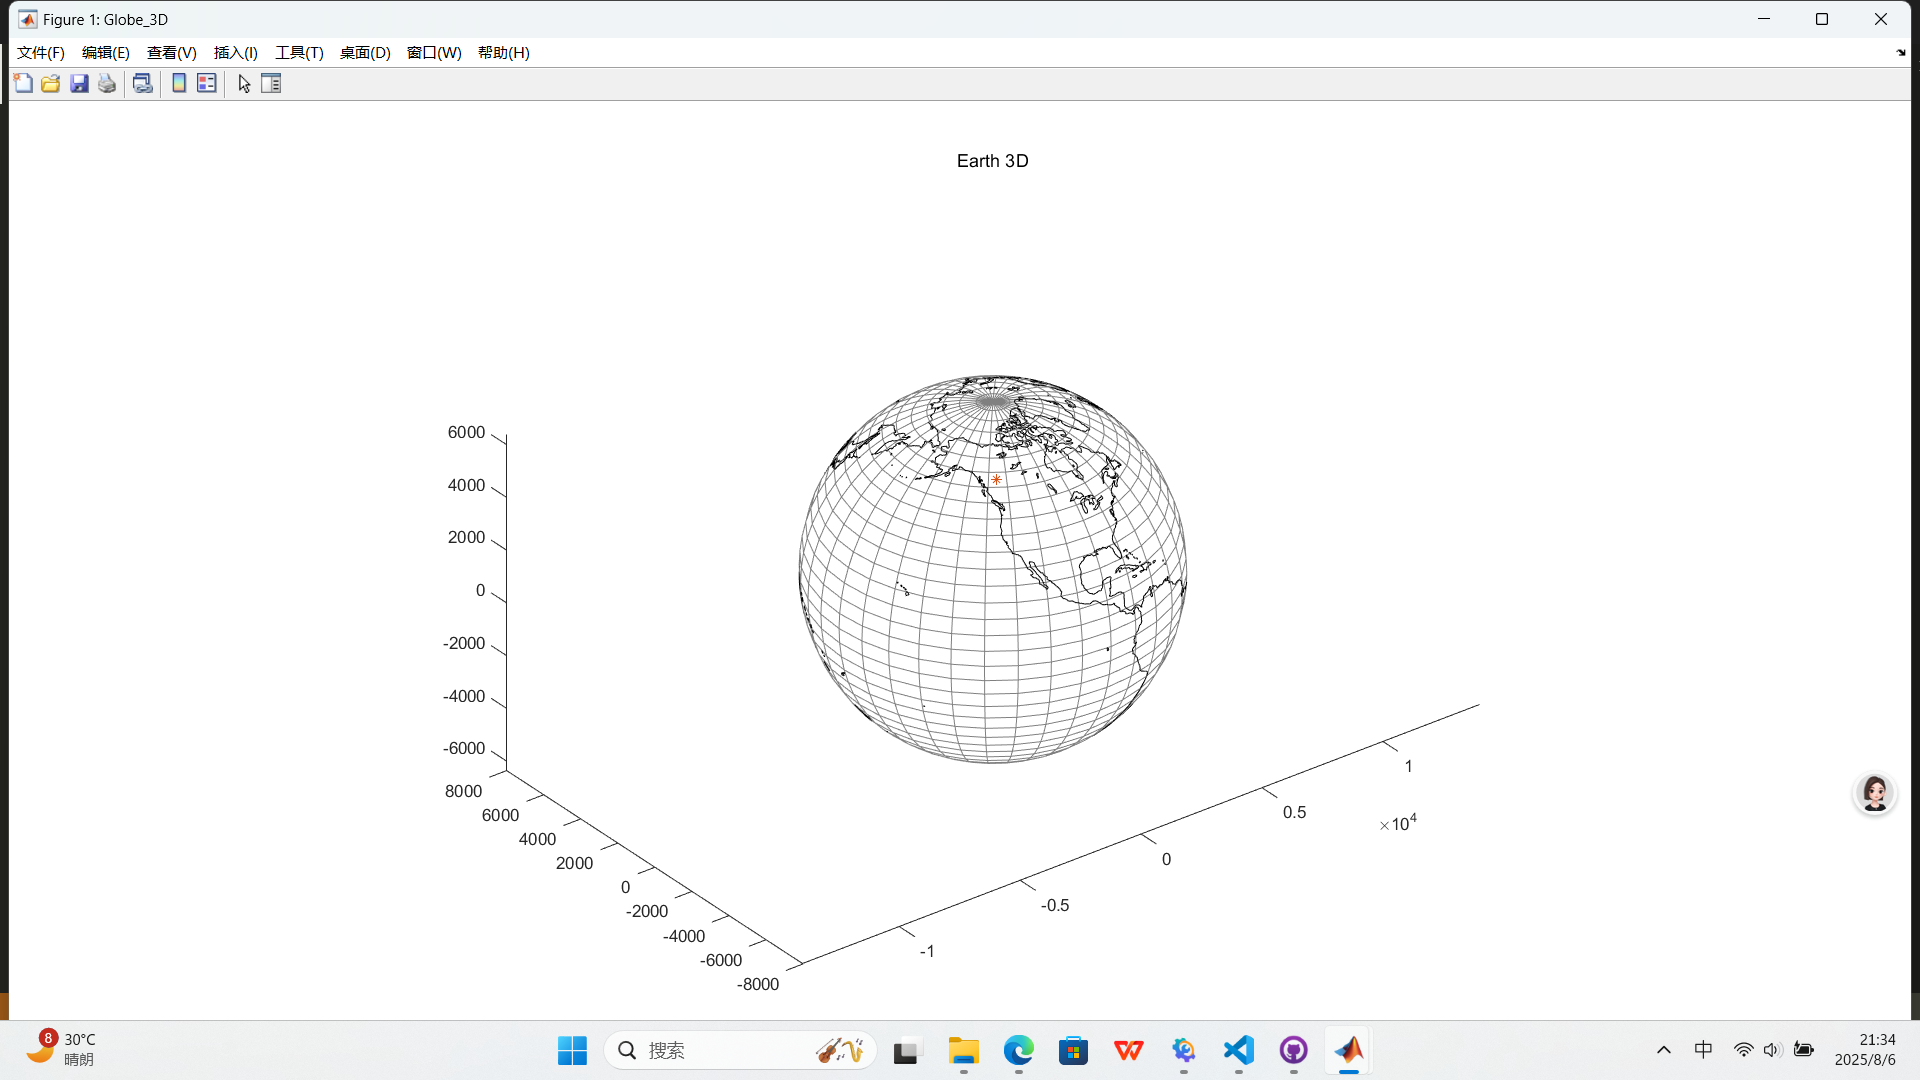
Globe_3D=plot_Globe_3D; %3d模型
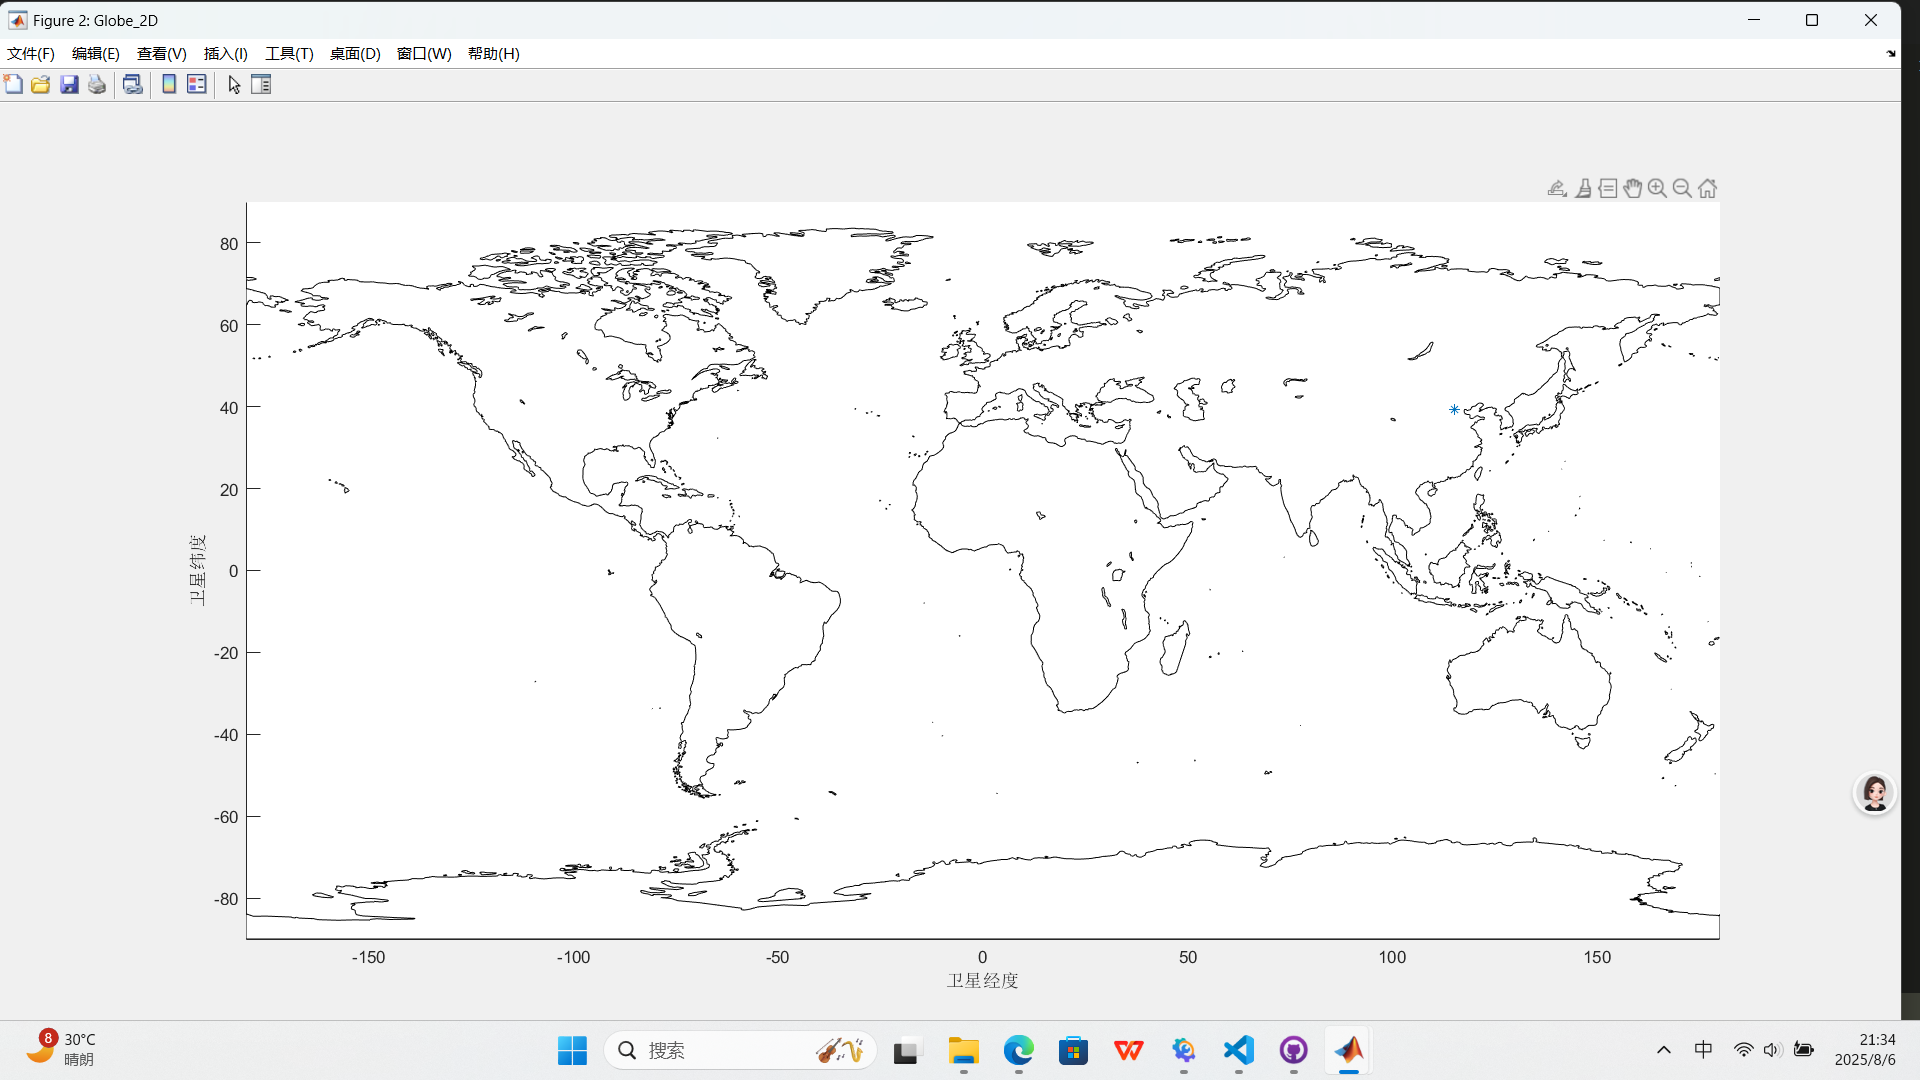
Globe_2D=plot_Globe_2D; %2d模型
figure(Globe_3D);
plot3(-2439,-3367,5826,'*');
figure(Globe_2D);
plot(115.25,39.26,'*');
%% 绘制卫星模型
% 卫星轨道基本信息
initial_params = struct();
initial_params.a = 6878; % 半长轴,单位为千米
initial_params.e = 0.001; % 偏心率
initial_params.i = 98; % 倾角,单位为度
initial_params.Omega = 30; % 升交点赤经,单位为度
initial_params.w = 120; % 近地点幅角,单位为度
initial_params.nu = 0; % 真近点角,单位为度
initial_params.velocity = [0, 0, 7.5]; % 初始速度向量,单位为千米/秒
initial_params.position = [0, 0, -initial_params.a]; % 初始位置向量,单位为千米
initial_params.mass = 500; % 卫星质量,单位为千克
disp(initial_params); % 打印卫星信息
%
plot_Globe_2D.mlx
绘制地球2D图形
 2D图像
2D图像
1
2
3
4
5
6
7
8
9
10
11
12
13
function Globe_2D=plot_Globe_2D
    % 地理常数
    Globe_2D=figure('Name','Globe_2D');
    axis([-180 180 -90 90])
    set(gcf,'outerposition', get(0,'screensize'));
    geoshow('landareas.shp', 'FaceColor', [1 1 1]);
    grid on
    hold

    grid;
    xlabel('卫星经度');
    ylabel('卫星纬度');
end
plot_Globe_3D.mlx
绘制地球3D图形
 3D图像
3D图像
1
2
3
4
5
6
7
8
9
10
11
12
13
14
15
16
17
18
19
20
21
22
23
function Globe_3D=plot_Globe_3D
    % 地理常数
    R_earth=6371;%地球半径,单位km

    %% 3D 模型
    % 绘制经度线
    Globe_3D=figure('Name','Globe_3D','color','w');
    title('Earth 3D');   %修改图名称
    set(gcf,'outerposition', get(0,'screensize'));
    hold on
    [x,y,z]=sphere(36);             % 生成一个球,36边,即分辨率:经度10度,纬度5度
    mesh(R_earth.*x,R_earth.*y,R_earth.*z,'EdgeColor',[0.5 0.5 0.5]);    % EdgeColor属性设置网格颜色
    axis equal;

    % 绘制海岸线
    load coastlines             % 导入海岸线数据
    x2=R_earth*cosd(coastlat).*cosd(coastlon);
    y2=R_earth*cosd(coastlat).*sind(coastlon);
    z2=R_earth*sind(coastlat);
    plot3(x2,y2,z2,'k')
    axis equal;     % 保持轴的比例一致
    view(3);         % 设置三维视角
end
This post is licensed under CC BY 4.0 by the author.